The Catalan Meteorological Service (SMC) has been working over the last few years to recover Barcelona's meteorological observations from 1780 up to the present day, by reconstructing the complete series of daily weather data for more than 230 years, which makes the Barcelona series one of the 10 longest, continuous series in Europe.
For further information on the origins of instrumental weather observation in Catalonia, go to (link to the SMC webpage) and for a detailed account of the stages in the data recovery and climatic series reconstruction project, go to (link to the SMC webpage)
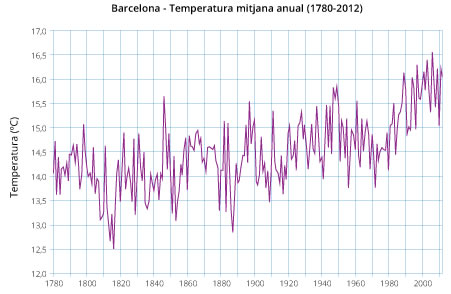
The graph displaying the change in Barcelona's annual mean temperature between 1780 and 2012 clearly shows the increase seen in this variable throughout that period, with the last 30 years being the warmest. It should be noted that the entire series of temperatures in Barcelona refers to data recorded at the Fabra Observatory, which is located on Tibidabo (410 metres above sea level).
Annual mean temperature (AMT) for the period 1780-2012
14,5 °C
AMT mean trend for the period 1780-2012
+0,07 °C/dècada
Global AMT increase for the period 1780-2012
+1,6 °C
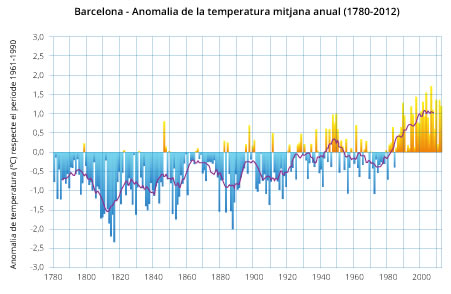
The seasonal change in the AMT can be shown by representing the annual anomaly with respect to the mean for the 1961-1990 period, i.e. the difference between the mean temperature for each year and the mean temperature for the 1961-1990 reference period. Moreover, this graph shows the change in the mobile mean for 11-year periods (the black curve, which is equivalent to the change in the mean temperature for 11-year groups, i.e. the mean temperature taking into account one year, the five previous years and the five subsequent years).
|
|
||||||||||||||||||||||||